Visualize the Location of Assets in Comparison to Tangible Risk Events with Archer’s New Mapping Fun
- Sep 7, 2023
- 1 min read
Updated: Oct 18, 2023
Everywhere you look today, there are reports on the news about something that could impact your supply chain and your business. It could be a fast-approaching hurricane, an active crime scene causing closure to parts of the city, or a traffic stoppage that halts deliveries of essential supplies.
It has become critical to have a supply chain risk management strategy, but creating an effective plan is challenging if you can't anticipate the challenges that will impact your organization to prioritize risks effectively when there are so many different types of challenges that organizations need to be prepared for to mitigate risk and limit impact to the organization.
Wouldn't it be nice to be able to anticipate potential disruptions and take action to minimize the impact on your company?
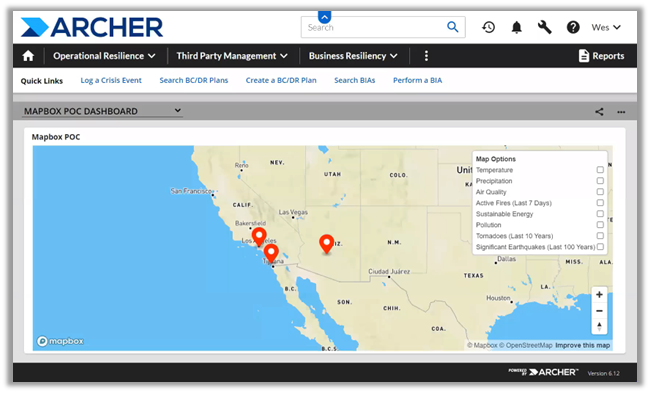
We are excited to introduce a new Archer report powered by Mapbox that allows organizations to see their physical locations, assets and third parties on a map, compare them to potential threats that could impact them, and take action to reduce the risk. If your organization – like most – could be impacted by certain threats of disruption or other risks, you'll love the way Archer and Mapbox connect the dots so you can take proactive steps - instead of reacting after your organization has been disrupted. This mapping capability is an essential tool in your efforts to build a more resilient organization.


