Two risks are red. Only one belongs in the budget.
Your heat map got you this far. In Archer Insight you price each risk, value every control, and show leadership where the next dollar should go.
Trusted by 1500+ enterprises
-
1,500+
Clients across 48 countries
-
50%
Of clients in the Fortune 500
-
65%
Of organizations putting more effort into quantification
-
15,000+
Members in the Archer risk community
Where the numbers come from, and who inside your program produces them
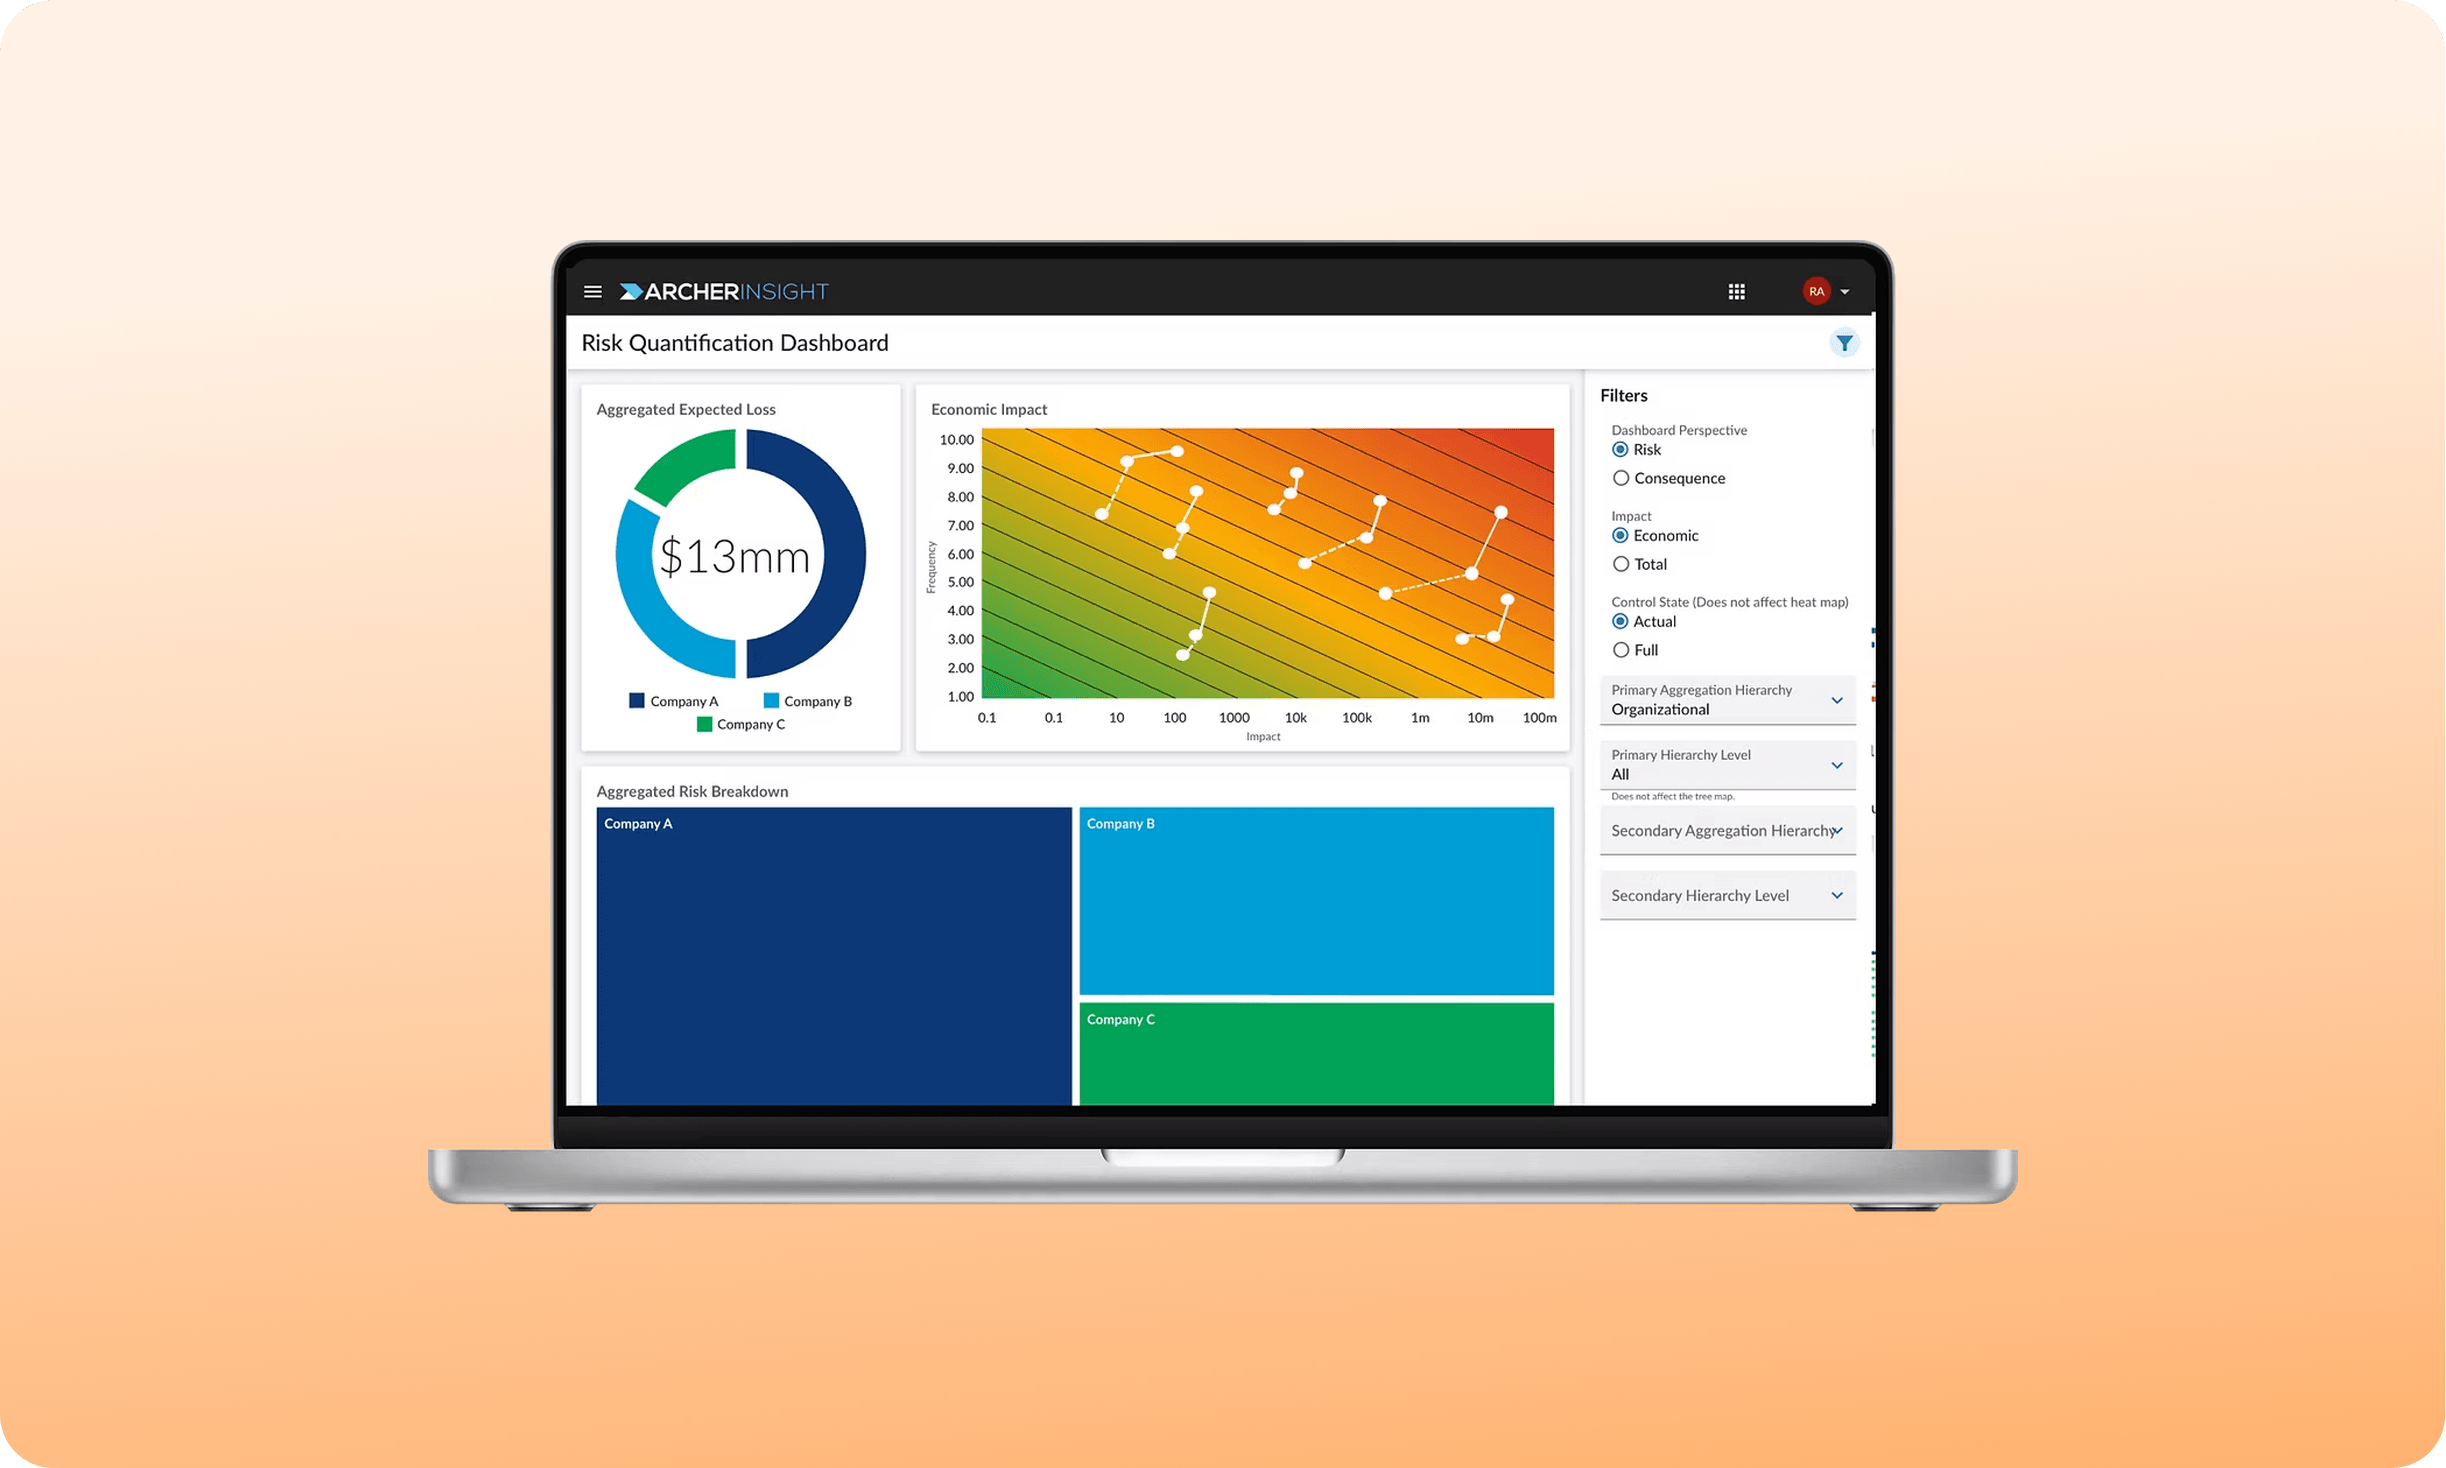
A heat map puts a plant fire and a payroll error in the same red box. That is as far as color goes. Insight asks how often each event happens and what it costs when it does, then builds the estimates from your own loss history.
-
Generate hundreds of risk records in one pass
-
Build estimates from loss history, not workshops
-
Trace every number to a record and an owner
What your team can finally say once every risk carries a price
Archer Insight turns heat maps into numbers you can defend.
One unit for every risk
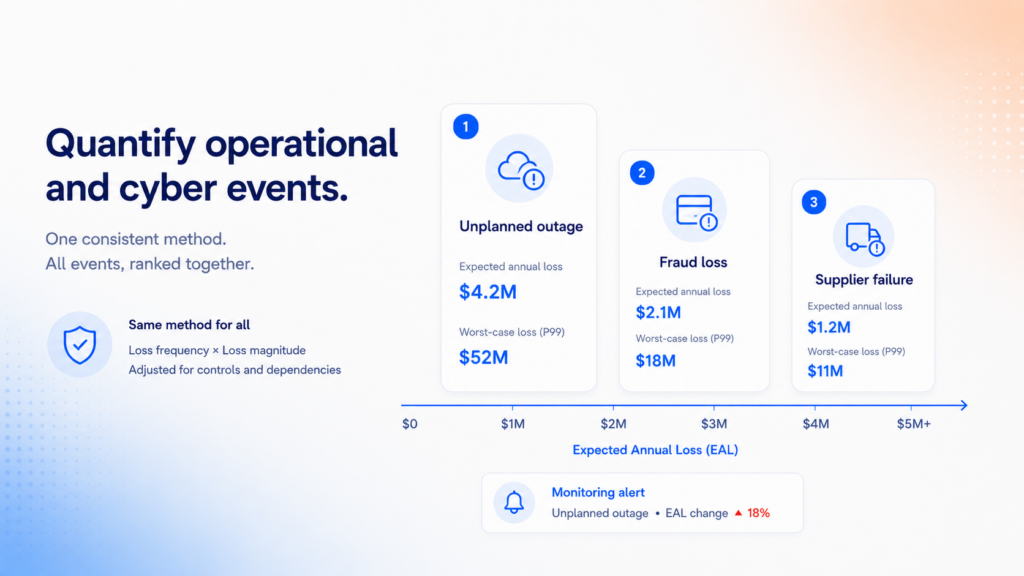
Your rate and impact estimates become expected annual loss. A cyber event and a supplier failure sit on one axis, in a rank order you can defend.
Controls with a price tag
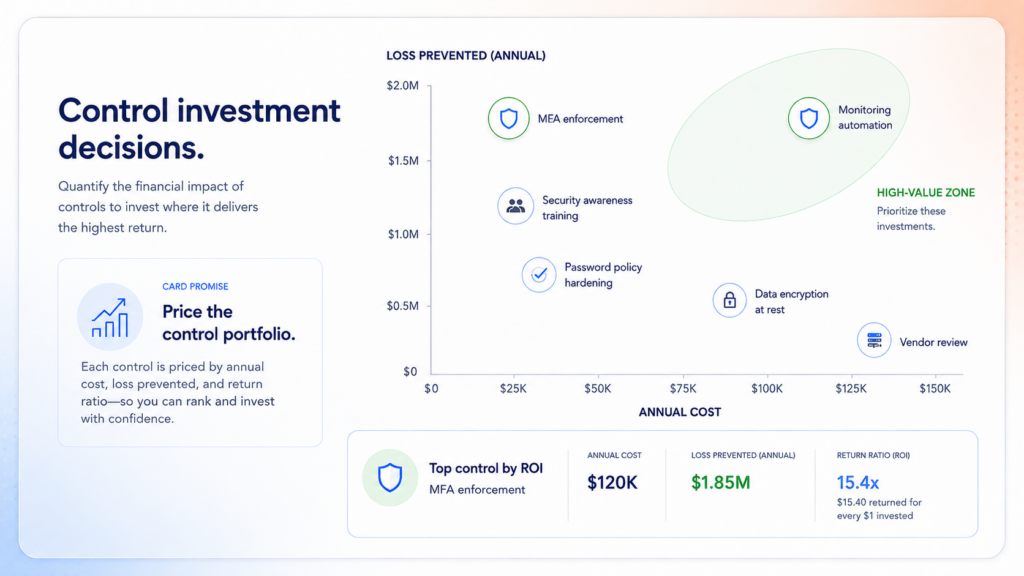
Set the annual cost of a control against the loss it prevents. Sort by net value ratio and you see which controls earn their keep and which ones coast.
Safety on the same axis
Score safety, environmental, and reputational consequences on scales your program defines, then aggregate them beside financial loss in one exposure view.

From empty register to finished board packet
Archer Insight handles the full quantification workflow from start to finish.
1
Risk generation at scale
Pick your risk statements and the facilities, processes, or applications they apply to. Archer generates one risk record per combination, with matching metrics.
2
Three assessment types
Assess a risk event as it runs today, compare it against a world with no working controls, or specify controls to test what a better one would be worth.
3
Loss history as an input
Feed historical loss events into an assessment, and the rate and impact estimates follow what already happened rather than what a room full of people remember.
4
A picture of the whole chain
Drivers, preventive controls, the event, mitigating controls, and consequences sit in one view, so anyone reviewing your number can follow how you got it.
5
Tail exposure, not averages
An average hides the year that hurts. Archer Insight calculates value at risk and conditional value at risk at the confidence level your program sets.
6
Controls scored as they run
Lifecycle and compliance status discount the credit a control earns, so a control that still sits in development never inflates the risk position you report.
Applied proof across your program
Enterprise risk management
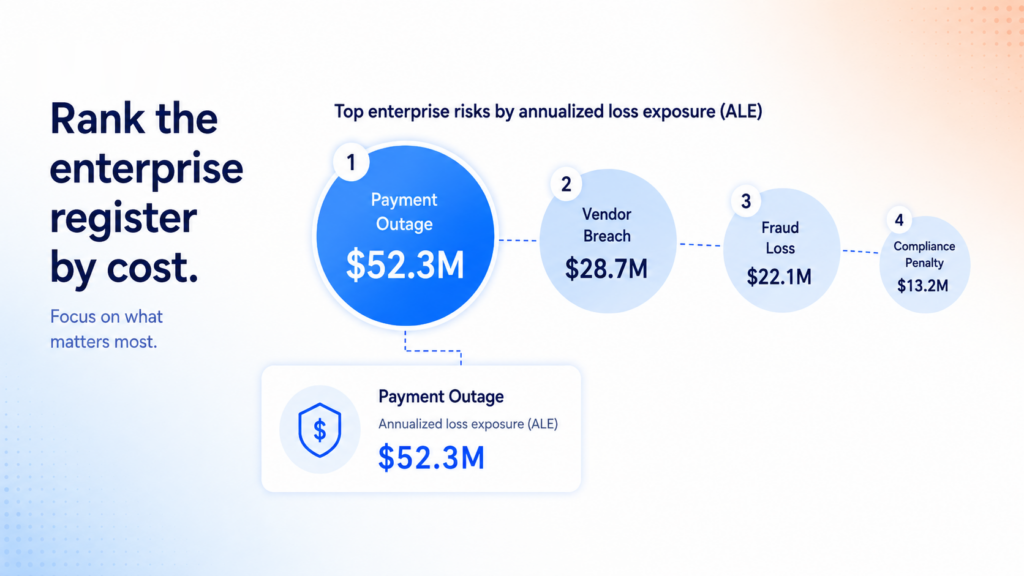
Rank the enterprise register by cost. Aggregate exposure from business unit to the top of the house, drill from a summary figure to the risk event driving it, and give the board a view it can question without sending your team back for a rebuild.
Operational and cyber risk
Quantify operational and cyber events with the same method the rest of the register uses. Compare an unplanned outage to a fraud loss to a supplier failure in one ranking, and answer the finance team on where the next control dollar belongs.
Control investment decisions
Price the control portfolio. Every control carries an annual cost, a value in loss prevented, and a ratio between the two. Defend the spend that works, retire the spend that does not, and walk into planning season with a ranked list, not an anecdote.
The images used above are not actual product screenshots.
Everything a quant program needs, nothing it doesn’t
Archer Insight covers what your program actually uses.
-
Quantitative assessments
Three ways to assess a single risk event
-
Control value analysis
Annual cost, value, and ROI for each control
-
Aggregated loss distributions
VaR and CVaR across every hierarchy level
-
Hierarchy aggregation
Roll exposure to any level you report on
-
Non-financial impact scale
Covers safety, reputation, and environment
-
Dashboard export to PDF or PPT
Charts, data, and the filters behind them
The six questions a heat map leaves open
Archer Insight closes the gap between ranking and pricing.
Heat maps and spreadsheets
Status quo for most programs.
Here’s what you get
-
Risks comparable across types: Only inside one scale, by judgment
-
Non-financial impact: A separate scale that never rolls up
-
Value of a control: You assume the control works
-
Tail exposure: Nowhere on the chart
-
Aggregation to any level: A manual rollup you rebuild each cycle
-
Traceable inputs: Lives in one analyst’s workbook
Archer Insight
Quantification built for your program.
Here’s what you get
-
Risks comparable across types: One financial measure covers every risk
-
Non-financial impact: Rolls up on the scale you define
-
Value of a control: Carries a cost and a value you can compare
-
Tail exposure: Value at risk and conditional value at risk
-
Aggregation to any level: Aggregates on demand across hierarchies
-
Traceable inputs: Every estimate ties to a record and an owner
DIY Compliance
Spreadsheets, shared drives, and tribal knowledge.
Here’s what you get
-
Manual tracking
-
Custom infrastructure
-
Custom updates
Explore Our Case Studies

Eastern Bank Uses Archer to Drive Business Processes and Streamline Compliance
- View case study:
- View case study: Banorte Bank Gains Accurate Picture of Risk with Archer
- View case study: Intuitive Surgical Migrated to Archer SaaS for their journey to empowered risk management
- View case study: Operational Resilience for Financial Services Institutions
More than 1,300 organizations run on Archer®, including half the Fortune 500 and 37 of the top 50 global banks. See what their teams were up against, what they built, and what changed.
Eastern Bank Uses Archer to Drive Business Processes and Streamline Compliance

Banorte Bank Gains Accurate Picture of Risk with Archer

Intuitive Surgical Migrated to Archer SaaS for their journey to empowered risk management
Operational Resilience for Financial Services Institutions
Trusted by the teams who carry the risk
Risk, compliance, and audit leaders on what changed after Archer Evolv was implemented.

We recognized the need for a GRC software platform that would be central to our ability to improve and transform our enterprise risk and compliance processes.
Archer is the source of truth, and it creates a nice audit trail for us. As an insurance company, we're audited by every governmental entity. Now we can say, here's our repository, take a look.

Risk aggregation is a big point for us, to see where our risk is located within the organization, and to give greater visibility for boards and executives.

Turkcell is using Archer as the main GRC tool in the company. It provides us a transparent and safe governance framework.

Archer gives us the ability to boil things down into numbers and specifics versus generalities. It's management by fact versus intuition or feel.

It connects all the different applications together, so you can use those cross-references and connections to make better business decisions, because you have it all in one place.
Questions we hear most often
Straight answers to what risk leaders ask before choosing Archer Insight.
No. Your risk team writes the statements, picks the facilities or processes they apply to, and gives rate and impact estimates in ranges. Archer Insight generates the records and runs the math, including the loss distributions and the aggregation.
From your own people, in ranges rather than single figures. Where loss history exists, feed it in and the estimates follow the record instead of memory. Where it does not, the no-controls comparison gives your team a defensible starting point.
Acceptance depends on your regulator and your auditor, so no vendor page should promise it. What Insight gives you is the trail they ask for: every estimate tied to an owner, the driver and control chain in one view, and exports that print their filters.
No, and the two work together. Keep assessing qualitatively where speed matters, then quantify the risks that reach a budget conversation. Non-financial consequences stay on scales your program defines, and safety and environmental impact still count.
A list of risk statements, the facilities, processes, or applications each one applies to, and the hierarchy you report against. Loss history and an existing control inventory both help the estimates along, and neither one gates a start.