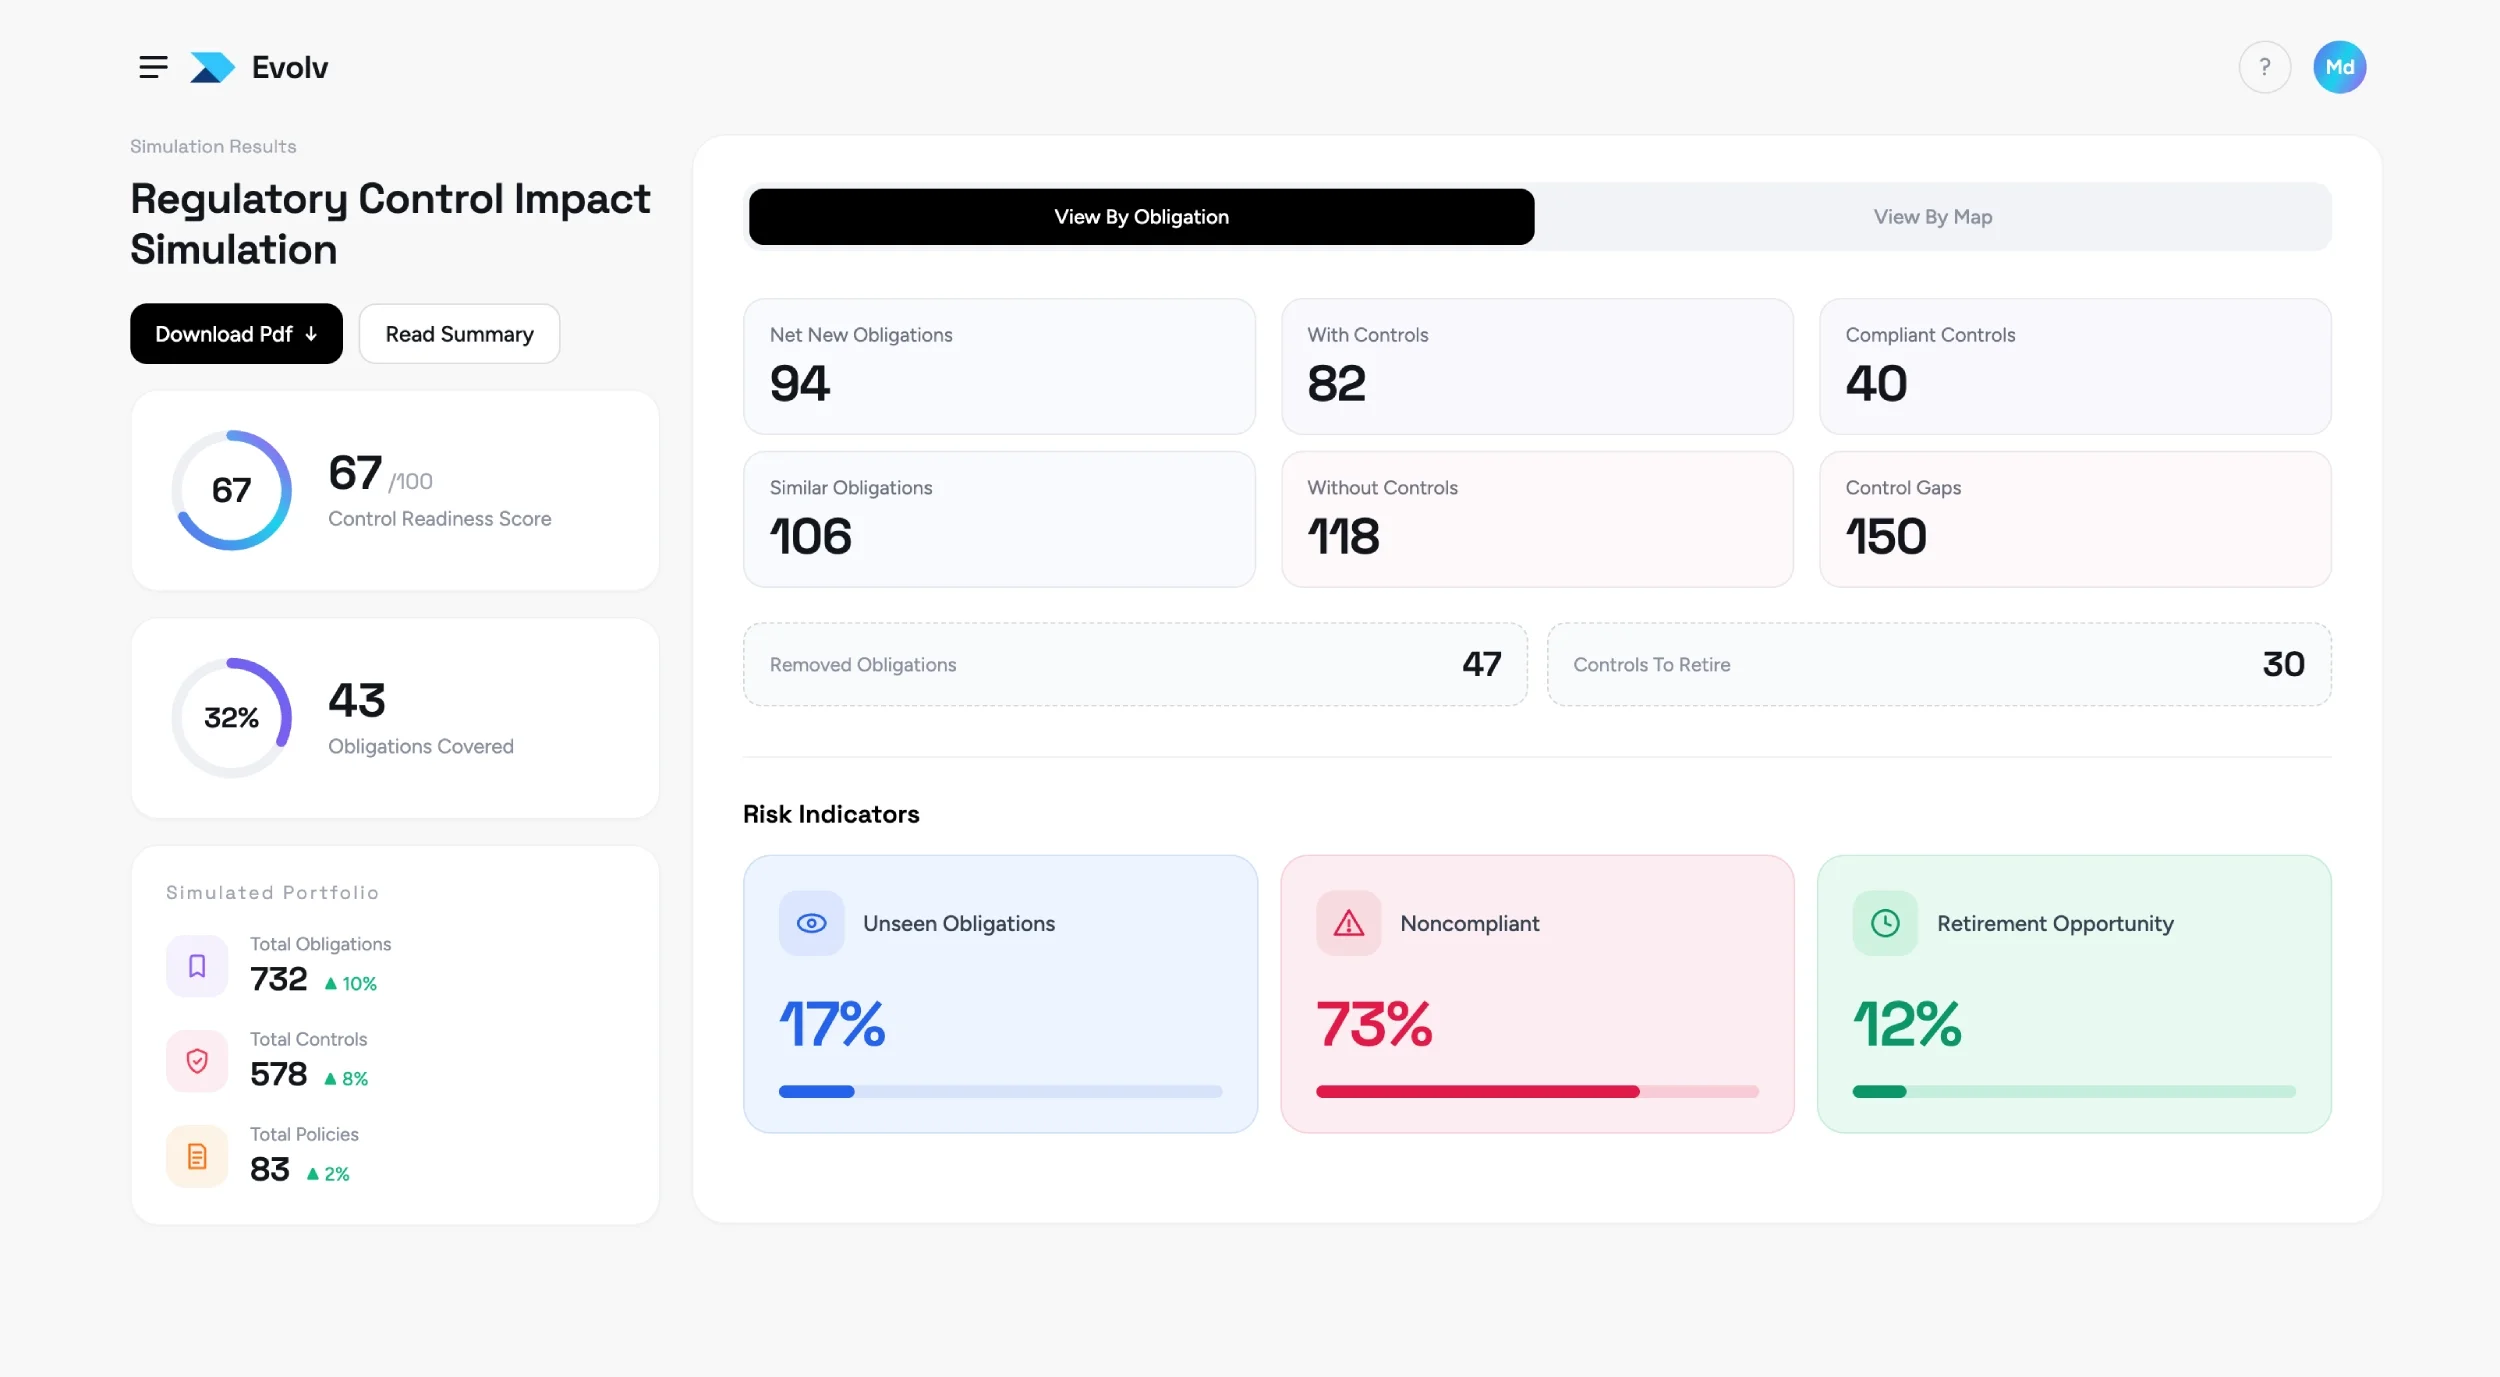
Two risks are red. Only one belongs in the budget.
Your heat map got you this far. In Archer Insight you price each risk, value every control, and show leadership where the next dollar should go.
Trusted by 1500+ enterprises
-
1,500+
Clienti in 48 paesi
-
50%+
Tra i clienti della classifica Fortune 500
-
65%
Delle organizzazioni che dedicano maggiore impegno alla quantificazione
-
15,000+
Membri della comunità di rischio Archer
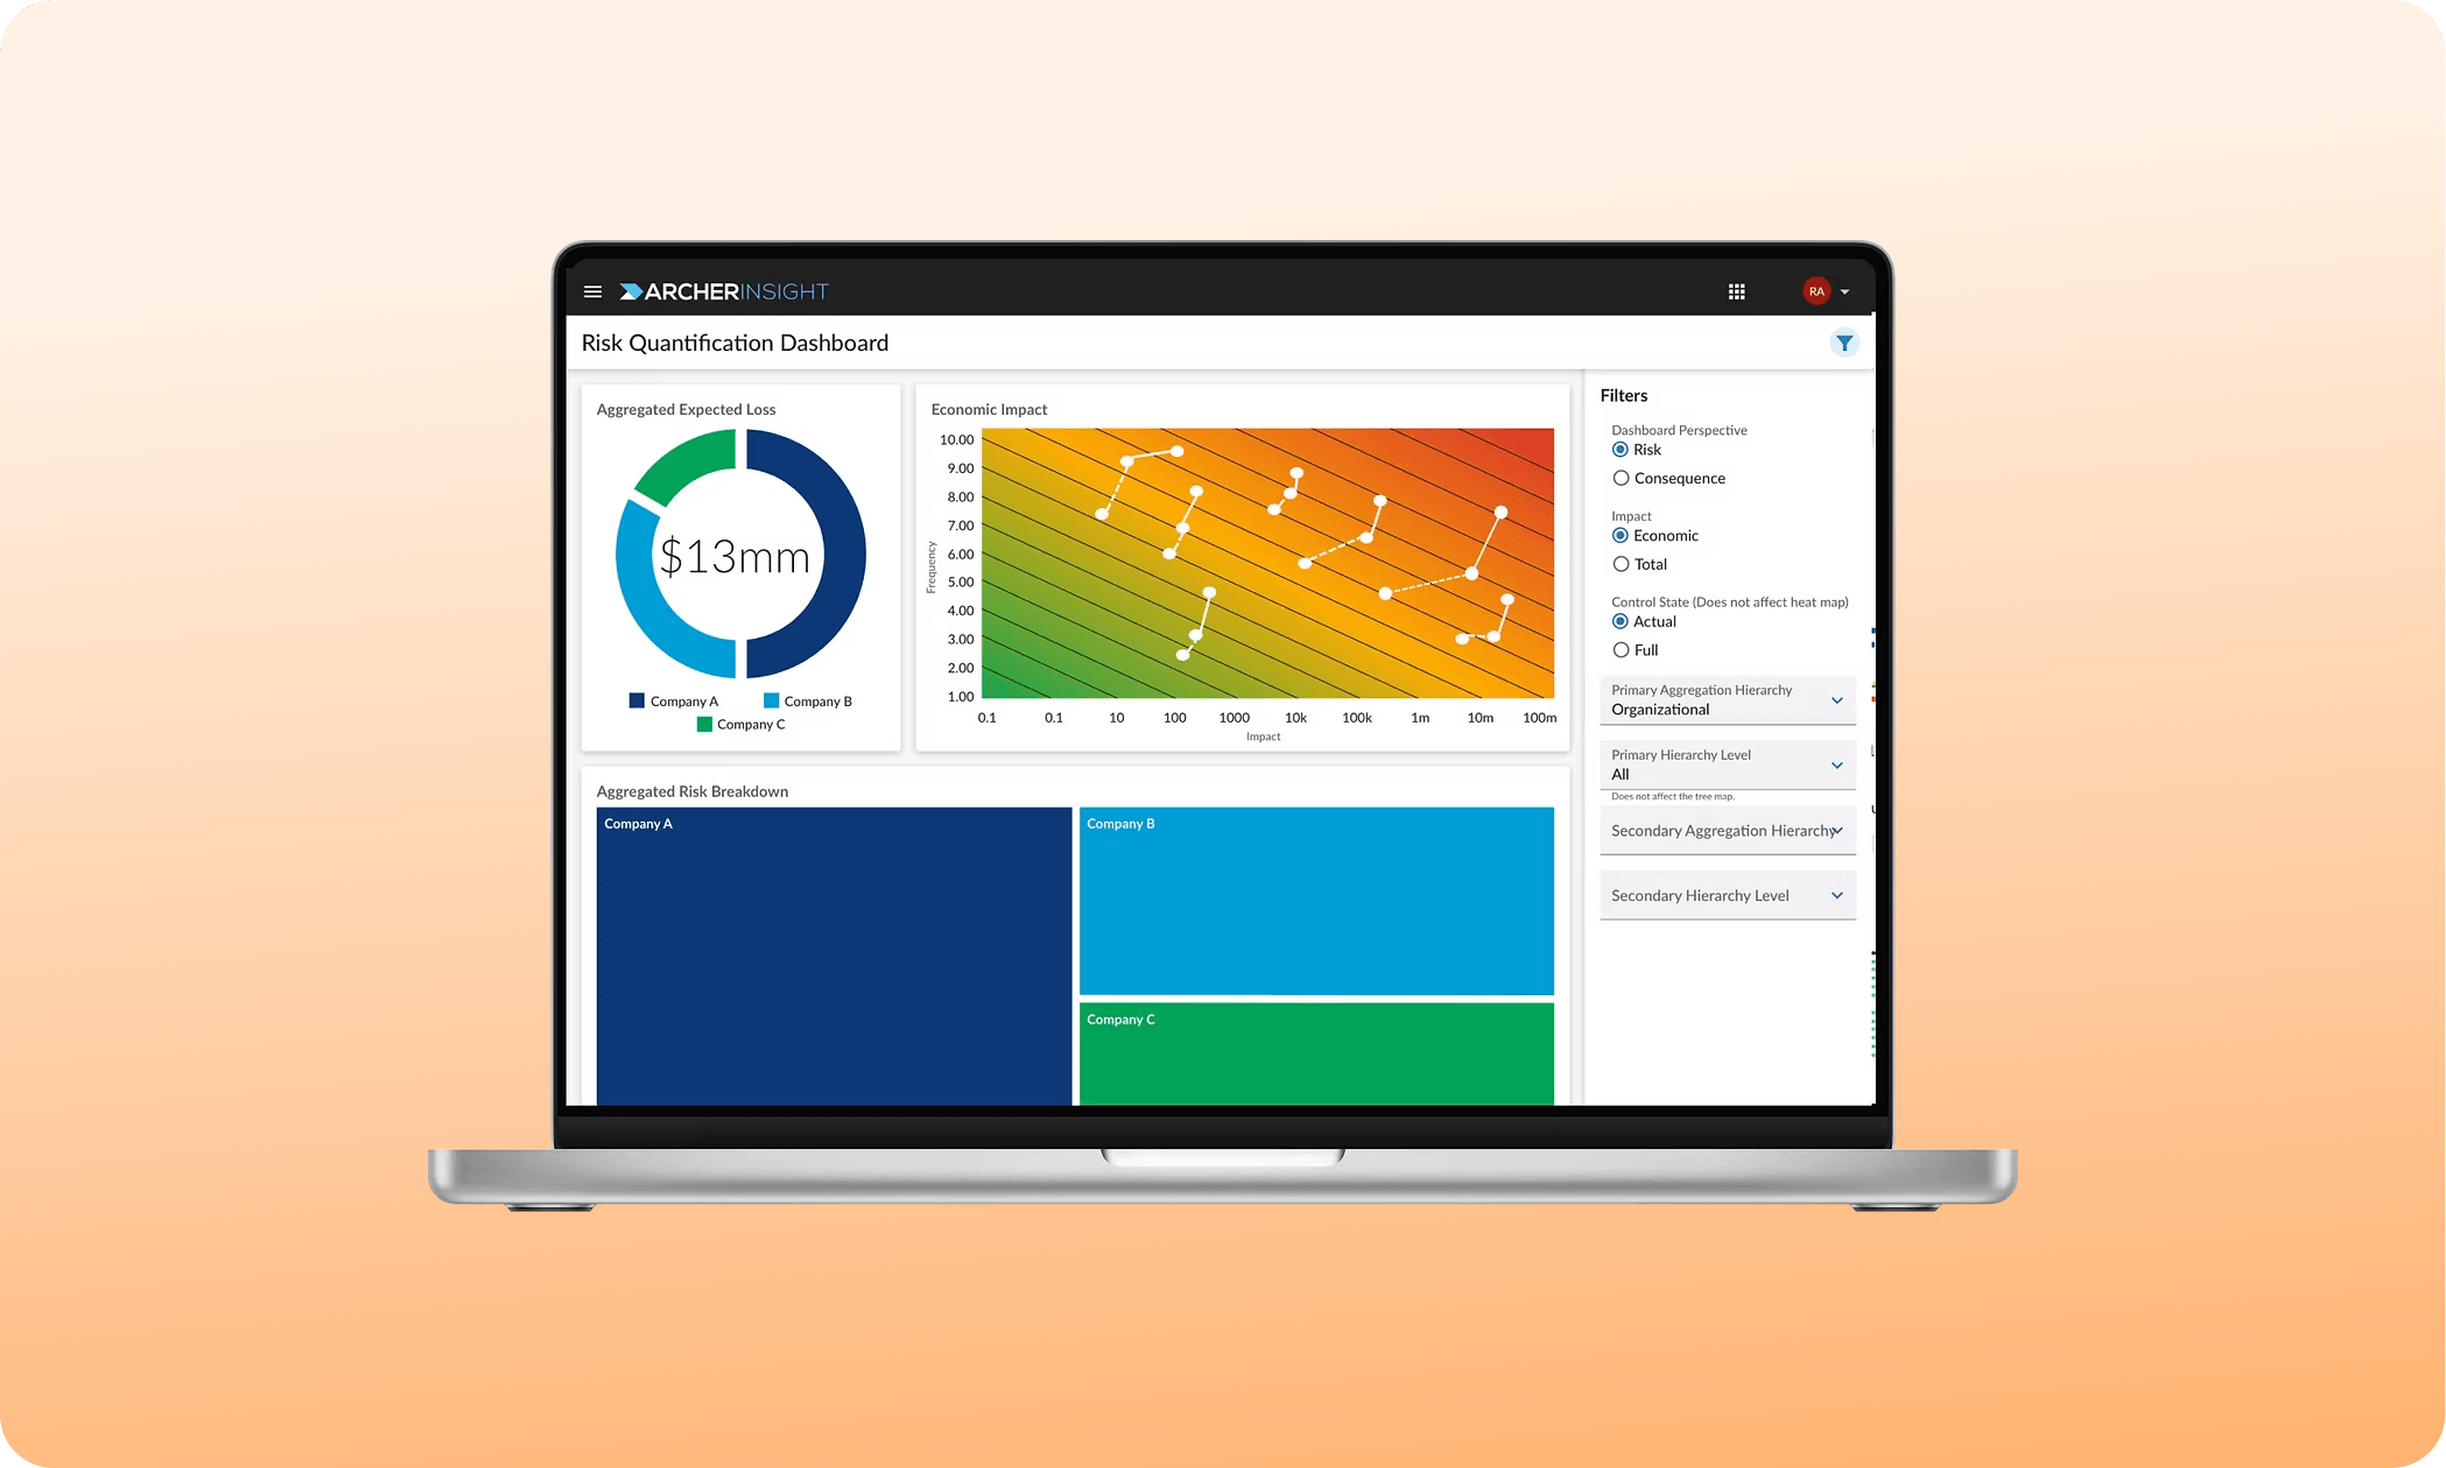
Where the numbers come from, and who inside your program produces them
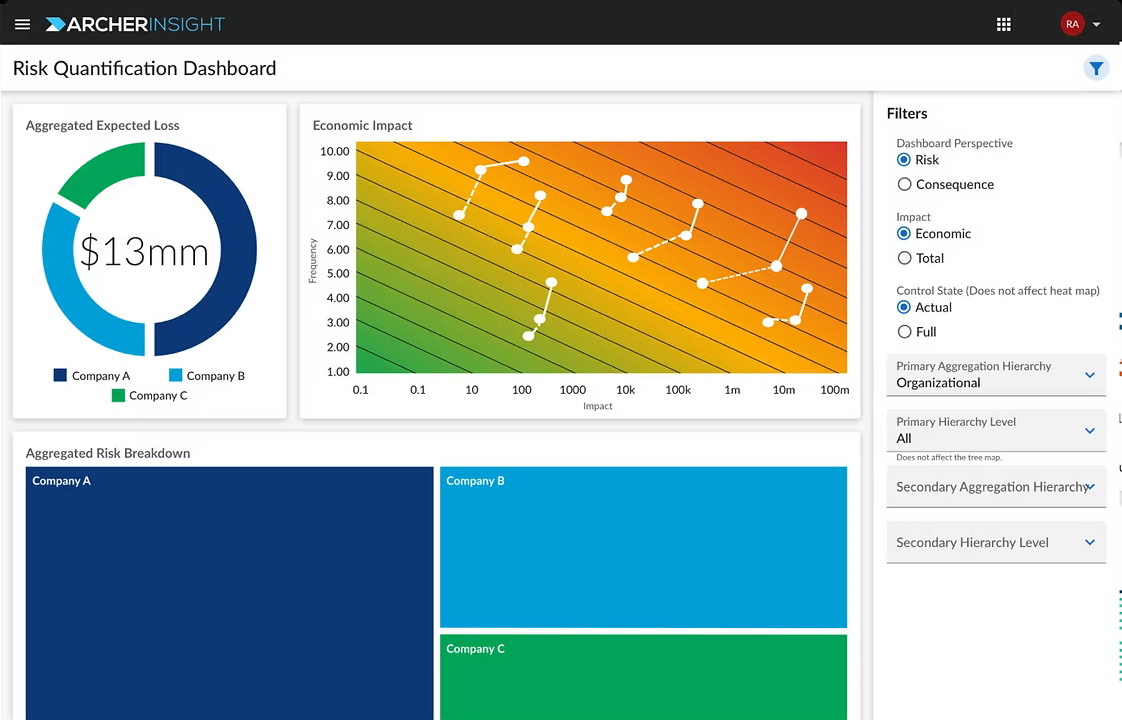
A heat map puts a plant fire and a payroll error in the same red box. That is as far as color goes. Insight asks how often each event happens and what it costs when it does, then builds the estimates from your own loss history.
-
Generate hundreds of risk records in one pass
-
Build estimates from loss history, not workshops
-
Trace every number to a record and an owner
What your team can finally say once every risk carries a price
Archer Insight turns heat maps into numbers you can defend.
One unit for every risk
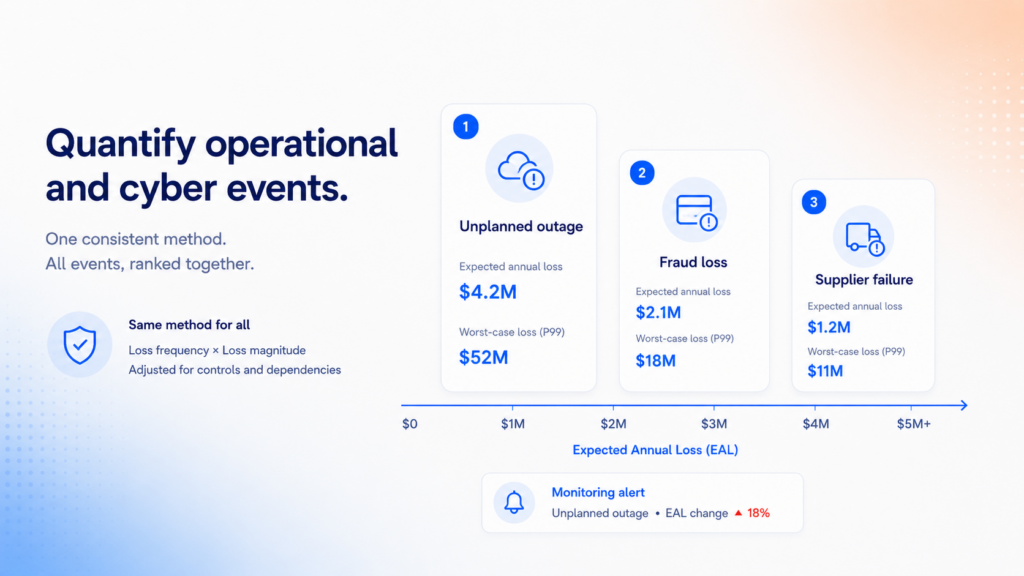
Your rate and impact estimates become expected annual loss. A cyber event and a supplier failure sit on one axis, in a rank order you can defend.
Controls with a price tag
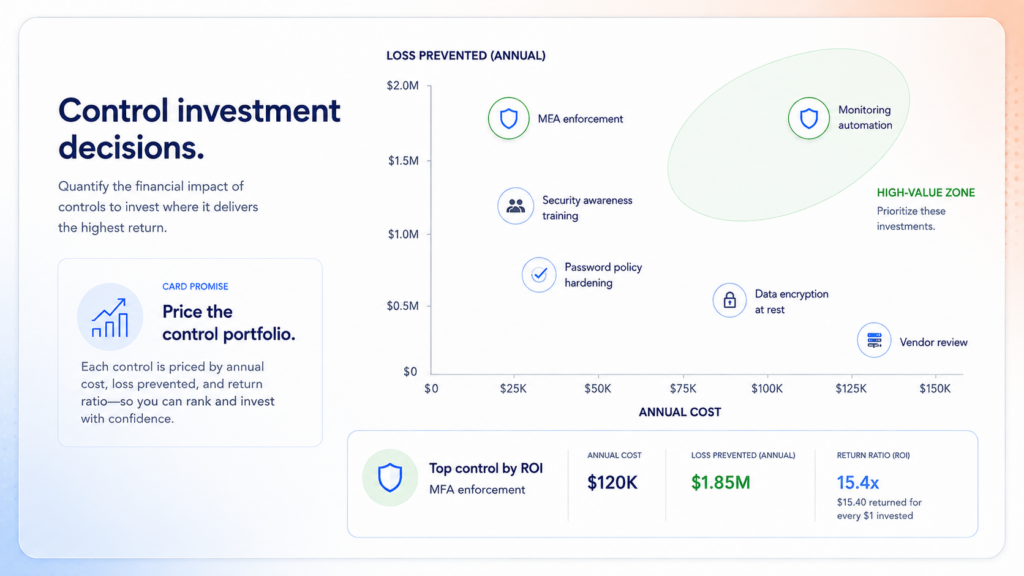
Set the annual cost of a control against the loss it prevents. Sort by net value ratio and you see which controls earn their keep and which ones coast.
Safety on the same axis
Score safety, environmental, and reputational consequences on scales your program defines, then aggregate them beside financial loss in one exposure view.

From empty register to finished board packet
Archer Insight handles the full quantification workflow from start to finish.
1
Risk generation at scale
Pick your risk statements and the facilities, processes, or applications they apply to. Archer generates one risk record per combination, with matching metrics.
2
Three assessment types
Assess a risk event as it runs today, compare it against a world with no working controls, or specify controls to test what a better one would be worth.
3
Loss history as an input
Feed historical loss events into an assessment, and the rate and impact estimates follow what already happened rather than what a room full of people remember.
4
A picture of the whole chain
Drivers, preventive controls, the event, mitigating controls, and consequences sit in one view, so anyone reviewing your number can follow how you got it.
5
Tail exposure, not averages
An average hides the year that hurts. Archer Insight calculates value at risk and conditional value at risk at the confidence level your program sets.
6
Controls scored as they run
Lifecycle and compliance status discount the credit a control earns, so a control that still sits in development never inflates the risk position you report.
Applied proof across your program
Enterprise risk management
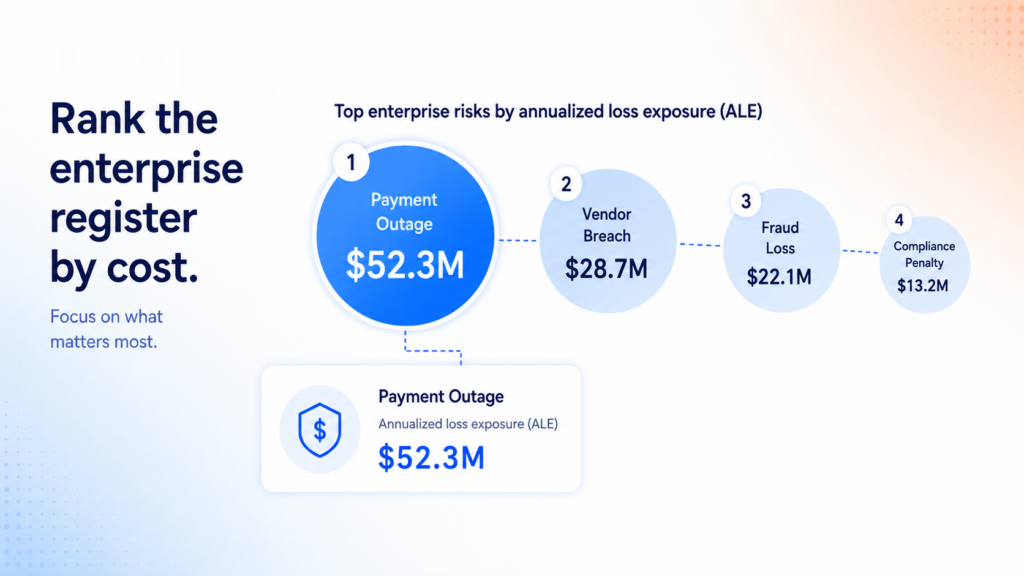
Rank the enterprise register by cost. Aggregate exposure from business unit to the top of the house, drill from a summary figure to the risk event driving it, and give the board a view it can question without sending your team back for a rebuild.
Operational and cyber risk
Quantify operational and cyber events with the same method the rest of the register uses. Compare an unplanned outage to a fraud loss to a supplier failure in one ranking, and answer the finance team on where the next control dollar belongs.
Control investment decisions
Price the control portfolio. Every control carries an annual cost, a value in loss prevented, and a ratio between the two. Defend the spend that works, retire the spend that does not, and walk into planning season with a ranked list, not an anecdote.
Le immagini riportate sopra non sono screenshot reali del prodotto.
Everything a quant program needs, nothing it doesn’t
Archer Insight covers what your program actually uses.
-
Quantitative assessments
Three ways to assess a single risk event
-
Control value analysis
Annual cost, value, and ROI for each control
-
Aggregated loss distributions
VaR and CVaR across every hierarchy level
-
Hierarchy aggregation
Roll exposure to any level you report on
-
Non-financial impact scale
Covers safety, reputation, and environment
-
Dashboard export to PDF or PPT
Charts, data, and the filters behind them
The six questions a heat map leaves open
Archer Insight closes the gap between ranking and pricing.
Heat maps and spreadsheets
Status quo for most programs.
Ecco cosa riceverai
-
Risks comparable across types: Only inside one scale, by judgment
-
Non-financial impact: A separate scale that never rolls up
-
Value of a control: You assume the control works
-
Tail exposure: Nowhere on the chart
-
Aggregation to any level: A manual rollup you rebuild each cycle
-
Traceable inputs: Lives in one analyst’s workbook
Archer Insight
Quantification built for your program.
Ecco cosa riceverai
-
Risks comparable across types: One financial measure covers every risk
-
Non-financial impact: Rolls up on the scale you define
-
Value of a control: Carries a cost and a value you can compare
-
Tail exposure: Value at risk and conditional value at risk
-
Aggregation to any level: Aggregates on demand across hierarchies
-
Traceable inputs: Every estimate ties to a record and an owner
Conformità fai da te
Fogli di calcolo, unità di rete condivise e conoscenze non documentate.
Ecco cosa riceverai
-
Monitoraggio manuale
-
Infrastruttura personalizzata
-
Aggiornamenti personalizzati
Scopri i nostri casi di studio

Eastern Bank utilizza Archer per ottimizzare i processi aziendali e semplificare la conformità normativa
- Visualizza il caso di studio:
- Visualizza il caso di studio: Banorte Bank ottiene un quadro preciso dei rischi grazie ad Archer
- Visualizza il caso di studio: Intuitive Surgical è passata ad Archer SaaS per intraprendere un percorso verso una gestione del rischio più efficace
- Visualizza il caso di studio: Resilienza operativa per gli istituti di servizi finanziari
Oltre 1.300 organizzazioni utilizzano Archer®, tra cui metà delle aziende della classifica Fortune 500 e 37 delle prime 50 banche mondiali. Scopri quali sfide hanno dovuto affrontare i loro team, cosa hanno realizzato e cosa è cambiato.
Eastern Bank utilizza Archer per ottimizzare i processi aziendali e semplificare la conformità normativa

Banorte Bank ottiene un quadro preciso dei rischi grazie ad Archer

Intuitive Surgical è passata alla piattaforma SaaS Archer per intraprendere un percorso verso una gestione del rischio più efficace
Resilienza operativa per gli istituti di servizi finanziari
Scelto con fiducia dai team che si assumono il rischio
I responsabili dei settori rischio, conformità e audit raccontano cosa è cambiato dopo l’implementazione di Archer Evolv.

Abbiamo riconosciuto la necessità di una piattaforma software GRC che fosse fondamentale per la nostra capacità di migliorare e trasformare i nostri processi aziendali in materia di rischio e conformità.
Archer è la fonte di verità e ci fornisce un'ottima traccia di audit. In qualità di compagnia assicurativa, siamo sottoposti a verifiche da parte di ogni ente governativo. Ora possiamo dire: “Ecco il nostro archivio, date un’occhiata”.

L'aggregazione dei rischi è un aspetto fondamentale per noi: ci permette di individuare dove si concentrano i rischi all'interno dell'organizzazione e di garantire una maggiore visibilità ai consigli di amministrazione e ai dirigenti.

Turkcell utilizza Archer come principale strumento di GRC all’interno dell’azienda. Ci offre un quadro di governance trasparente e sicuro.

Archer ci offre la possibilità di sintetizzare le cose in cifre e dettagli concreti anziché in generalità. Si tratta di una gestione basata sui fatti anziché sull'intuizione o sulla sensazione.

Mette in comunicazione tutte le diverse applicazioni, consentendoti così di sfruttare tali riferimenti incrociati e collegamenti per prendere decisioni aziendali più efficaci, poiché hai tutto a portata di mano in un unico posto.
Le domande che ci vengono poste più spesso
Straight answers to what risk leaders ask before choosing Archer Insight.
No. Your risk team writes the statements, picks the facilities or processes they apply to, and gives rate and impact estimates in ranges. Archer Insight generates the records and runs the math, including the loss distributions and the aggregation.
From your own people, in ranges rather than single figures. Where loss history exists, feed it in and the estimates follow the record instead of memory. Where it does not, the no-controls comparison gives your team a defensible starting point.
Acceptance depends on your regulator and your auditor, so no vendor page should promise it. What Insight gives you is the trail they ask for: every estimate tied to an owner, the driver and control chain in one view, and exports that print their filters.
No, and the two work together. Keep assessing qualitatively where speed matters, then quantify the risks that reach a budget conversation. Non-financial consequences stay on scales your program defines, and safety and environmental impact still count.
A list of risk statements, the facilities, processes, or applications each one applies to, and the hierarchy you report against. Loss history and an existing control inventory both help the estimates along, and neither one gates a start.